Learn about the TxCAN FAFSA Completion Dashboard as well as the NCAN FAFSA Data Tracker which enables practitioners to navigate the FAFSA season with confidence and clarity.
At the heart of TxCAN’s efforts lies a commitment to empower college access practitioners with comprehensive data tools enabling informed decision-making. As a result, TxCAN wants to ensure college access practitioners have access to the data they need to track their progress and inform their advising practice. One piece of data that is critical to Texas practitioners is FAFSA Data.
In Texas, practitioners can leverage the TxCAN FAFSA Completion Dashboard and NCAN’s FAFSA Data Tracker to access and compare FAFSA data across various educational entities, nationally and statewide. Let’s delve into deciphering these data dashboards that will aid practitioners in navigating the FAFSA season with confidence and clarity.
TxCAN FAFSA Completion Dashboard
The TxCAN FAFSA Completion Dashboard allows practitioners to compare FAFSA completion rates to other Educational Service Centers in Texas, as well as compare by county, district, and high school campus by selecting the different options on the top of the screen. The Texas completion rates will always show as the bar graphs in the background of the chart. On the right side of the dashboard, users can use the buttons to select specific school years and student groups of interest.
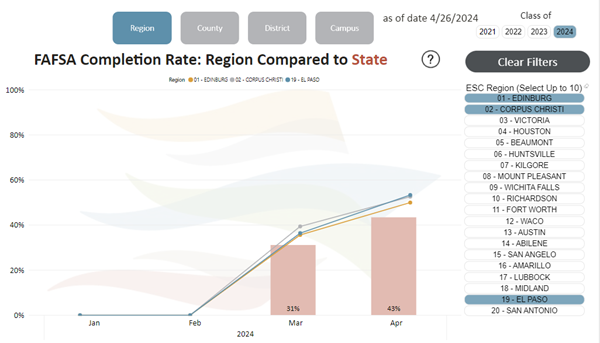
Note that due to the 2024-2025 FAFSA delay, the compressed timeline of this year’s financial aid cycle, coupled with known issues, poses challenges for FAFSA completion nationwide.
NCAN FAFSA Completion Tracker
The NCAN FAFSA Tracker dashboard offers a variety of perspectives on FAFSA data. Users can access national and state-level metrics, track year-over-year changes, and explore submission trends by school, city, district, and state. With customizable visualizations and dynamic tools, the dashboard provides comprehensive insights into FAFSA completion rates and performance metrics across different demographics and geographical regions.
How to navigate the NCAN FAFSA Tracker
At present, the NCAN FAFSA Tracker offers eight tabs, each with a different way of looking at these data:
- The Home Page offers national-level data on percent change and percent of seniors completing a FAFSA as well as state-level rankings by these two metrics.
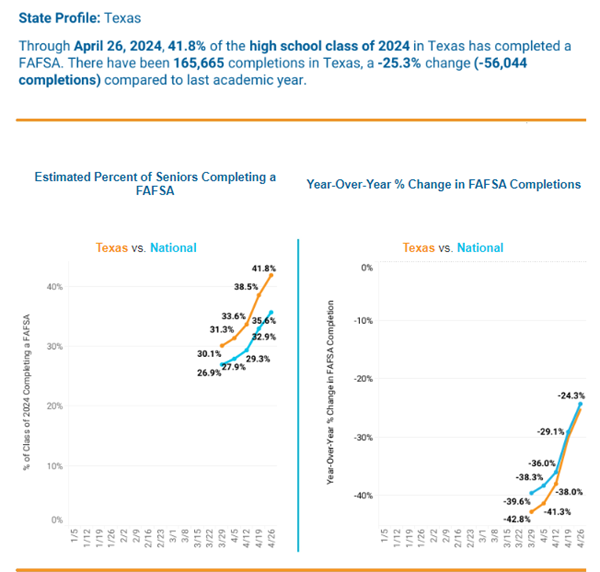
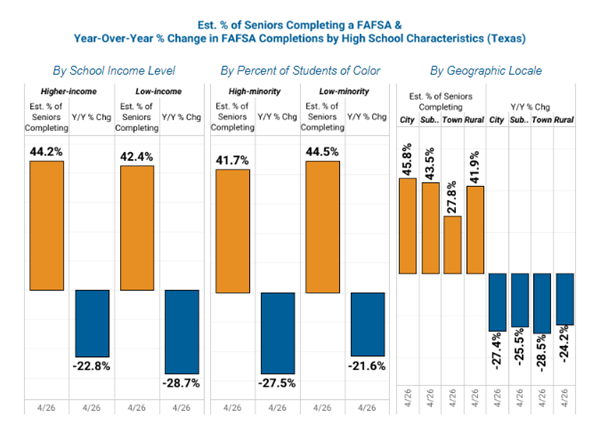
- State Profile includes state-level data on percent change and percent of seniors completing as well as state-level year-over-year change and percent of seniors completing estimates by high school categories (income, percent of students of color, and geography). This page also includes city, district, and school-level year-over-year changes. Further into the cycle, we will expand the profile to include scatterplots and other visualizations that explore in-state FAFSA completion trends.
- School Completions by Cycle includes the number of FAFSA completions for a given high school (filterable by state and school district) for the high school classes of 2023 and 2024 by date of the current cycle. If your high school does not appear, try setting district to “Null” and try again. Please email debaunb@ncan.org if you see something amiss, and we will work to fix the district-school connection moving forward. Note that all private high schools should set district to “Null.”
- US/States by Cycle harnesses NCAN’s longitudinal data on FAFSA completion and offers line charts on year-over-year percent change and the estimated percent of seniors completing for the high school classes of 2017-2024. This page includes national charts and a set of state charts that are adjustable by state.
- Submit/Complete Table includes class of 2024 Submission and Completion data by state.
- The Bar Chart by Cycle is a new visualization for the 2024-25 cycle. Use the date slider to see state-level FAFSA completion rates through a given date span across the classes of 2018-2024. This visualization is similar to US/States by Cycle but more customizable.
- Week-to-Week State Ranks plots states’ ranks by the Tracker’s two key metrics across the current cycle.
- State Scatterplot plots states’ year-over-year percent change by their percent of seniors completing the FAFSA to show both absolute and relative performance compared to other states. States’ circles are weighted by the number of their completions.
- City, District, and School Ranks display city, district, and school level year-over-year change and are filterable by state.
24-25 FAFSA Data Sharing Considerations
It’s essential to approach this year’s FAFSA data with caution due to the compressed timeline and known challenges. While direct comparisons to previous years may be necessary to understand the FAFSA completion gap, understanding the unique circumstances of the 2024-2025 cycle is also imperative. The potential disruption in FAFSA completions poses significant implications for students’ postsecondary plans, underscoring the importance of addressing the completion gap.
At TxCAN we hope these data tools and considerations will empower users to navigate the FAFSA season with confidence and clarity. As we continue to support students on their journey to higher education, let’s remain vigilant, adaptable, and focused on ensuring equitable access to postsecondary opportunities for all.
Author
The Texas College Access Network (TxCAN) connects and supports college access initiatives across Texas, with the goal of increasing access to college and certificate programs.